Did Dr. Mark Z. Jacobson just call anyone supporting nuclear energy a zealot?

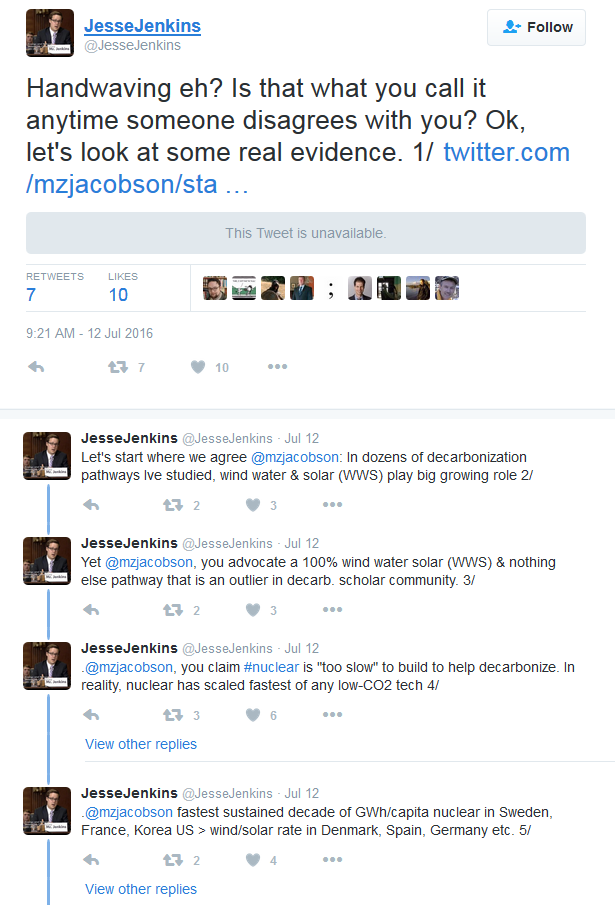
Recently, Jesse Jenkins, a PhD student at MIT studying decarbonization pathways, was blocked on twitter by Dr. Mark Z. Jacobson. Dr. Jacobson has made it a habit to block seemingly anyone who disagrees with him, but this time it was pretty absurd. Jenkins was trying to have a dialog with Dr. Jacobson about his claim that a 100% Wind/Water/Solar (WWS) strategy is the fastest, cheapest way to reduce carbon emissions. This is a claim that Dr. Jacobson has made repeatedly, but most other research in the topic disagrees.

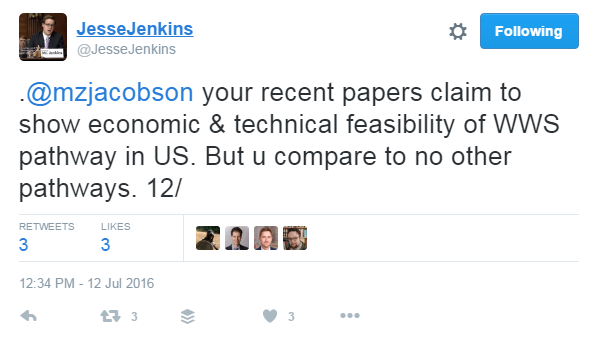
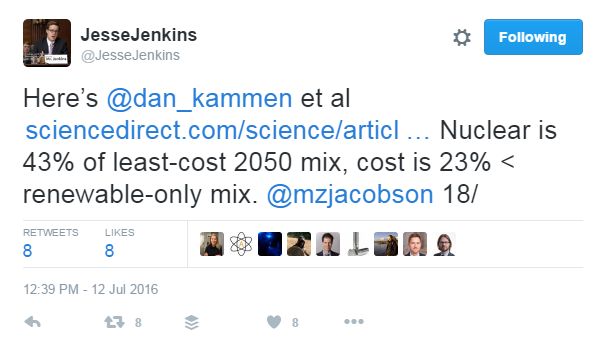
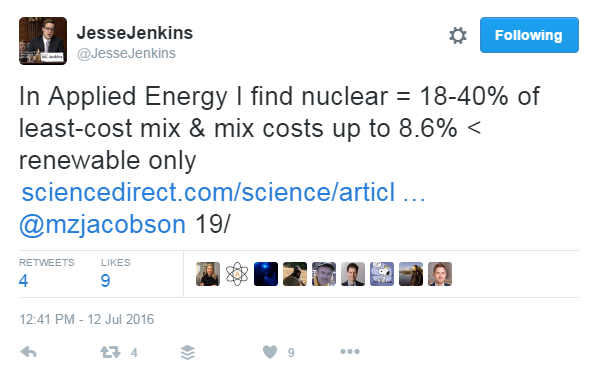
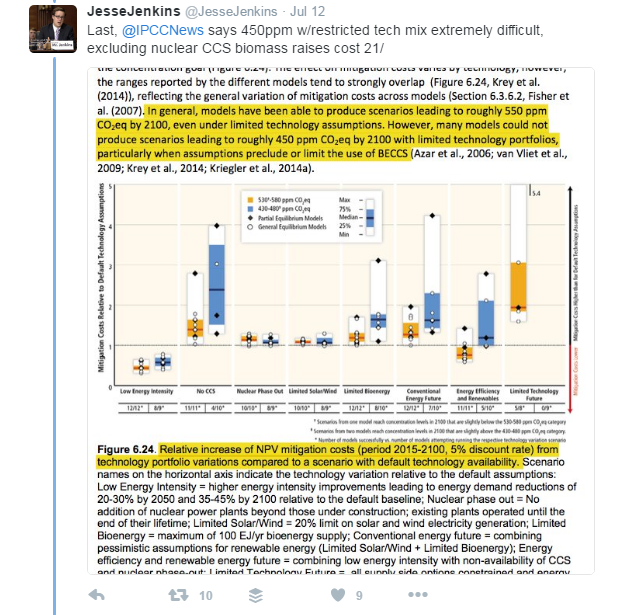
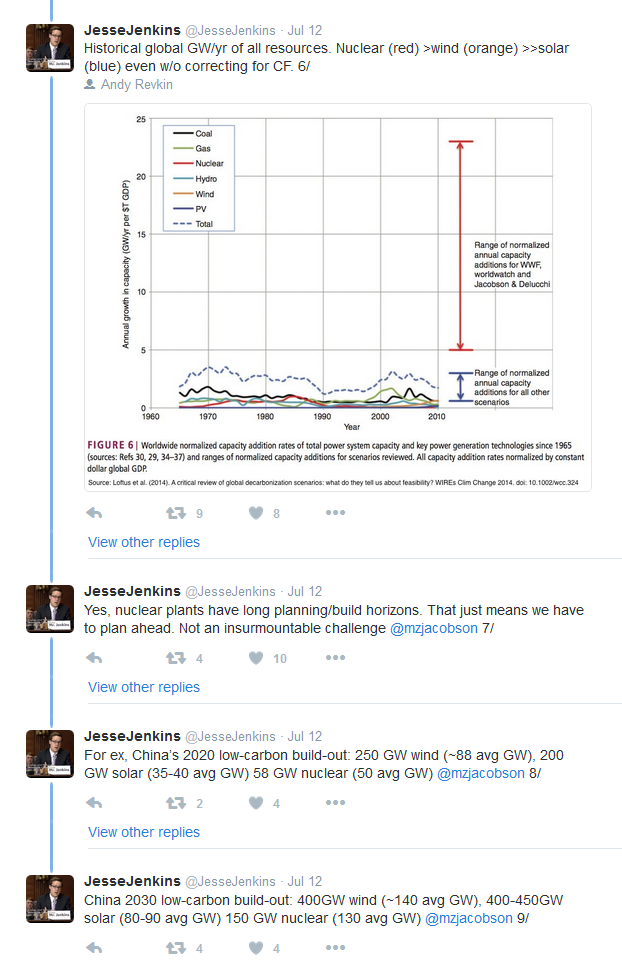
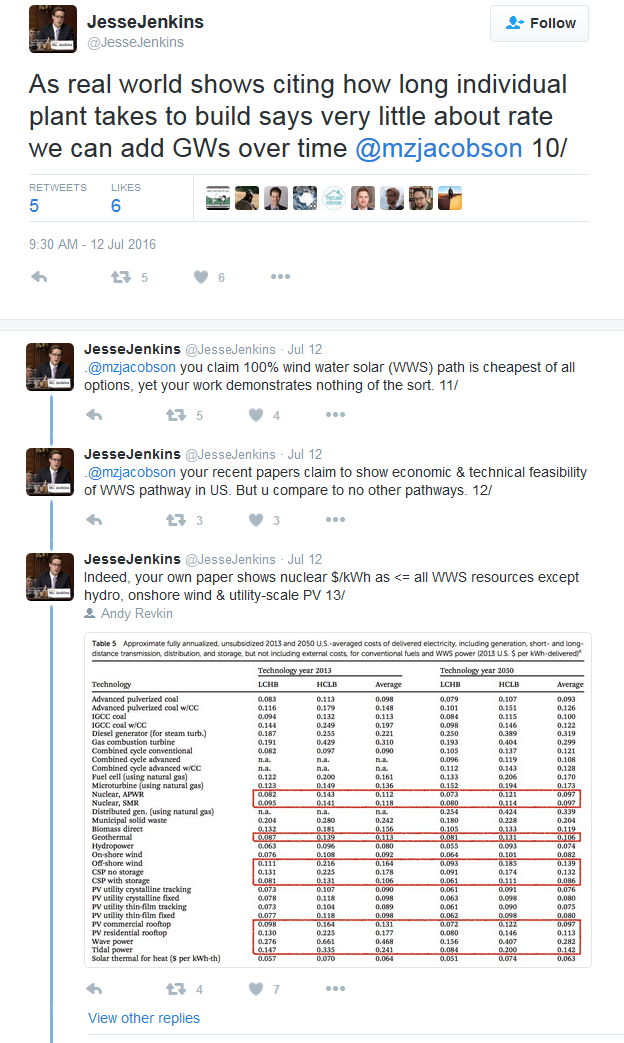
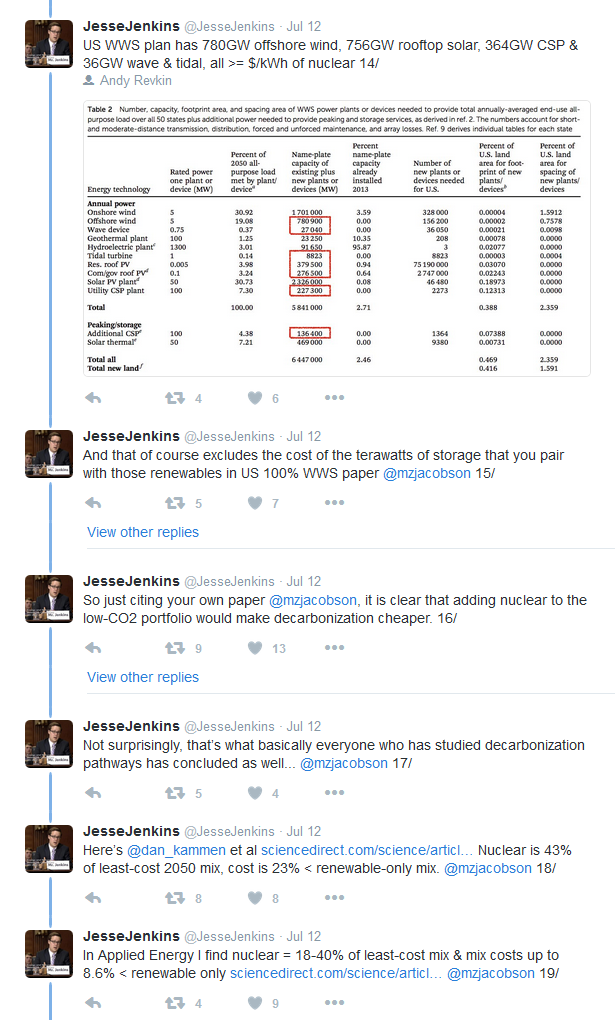
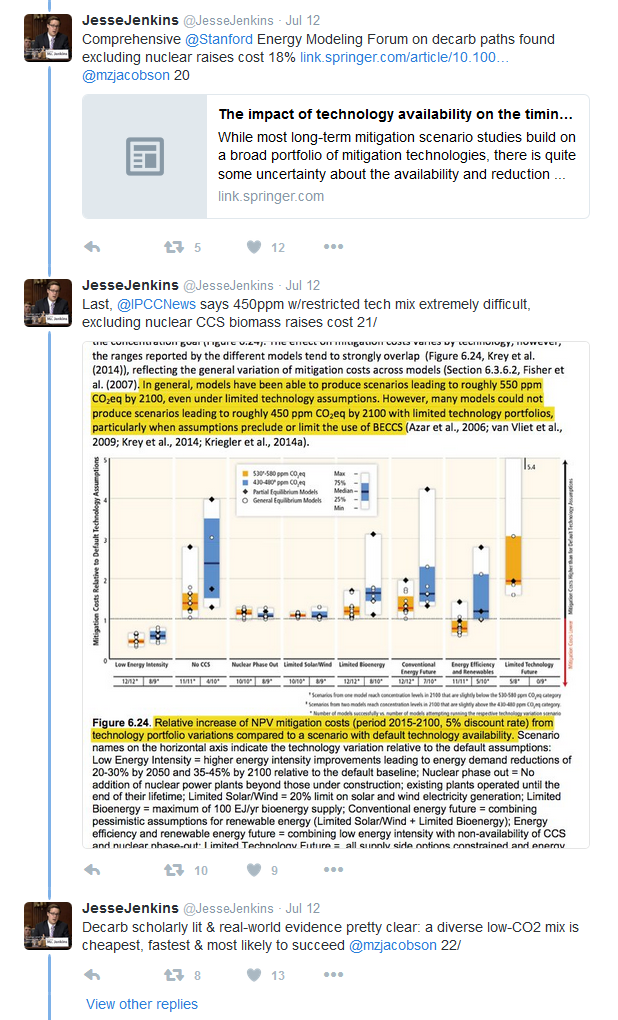
Jenkins specifically pointed out that in Dr. Jacobson’s own studies, nuclear is cheaper than geothermal, off-shore wind, concentrating solar power, rooftop solar, wave power, and tidal power – meaning adding nuclear would make the plan cheaper. Jenkins also pointed out that Dr. Jacobson hasn’t compared his preferred pathway against others that include nuclear [1]. Jenkins made point [2] after point [3] about how other studies have shown adding nuclear makes plans cheaper and that even the Intergovernmental Panel on Climate Change (IPCC), the UN scientific authority on climate change, says excluding nuclear increases costs [4]. The entire thread (tweetstorm) is great, and can be found here and here [5,6,7,8,9,10]. (Sidenote, in this piece, I’m including the link to each tweet, followed by a link to a screenshot of it, like this: link [link to screenshot]).

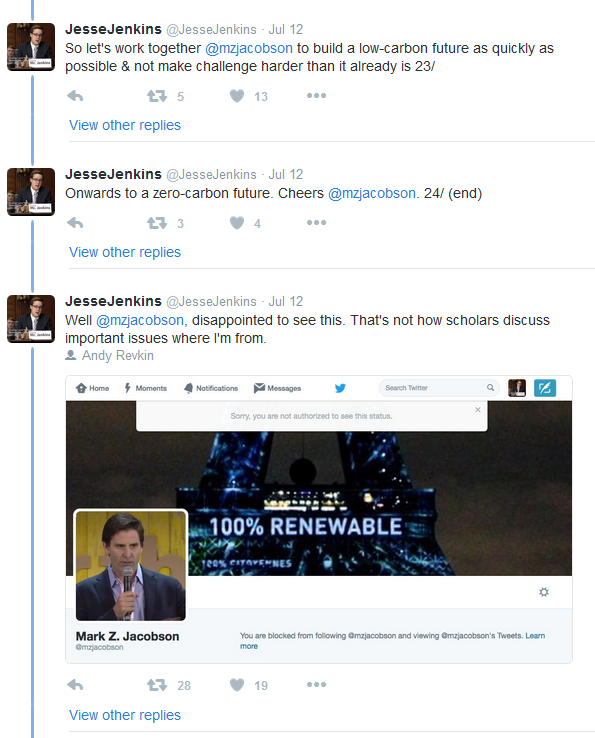
Jenkins wasn’t attacking Dr. Jacobson; he laid out a clear and cogent argument for why adding nuclear is cheaper, and how nuclear has historically scaled faster than renewables. And at the end, Jenkins added an open invitation to work together with Dr. Jacobson on further research. And instead, Dr. Jacobson blocked Jenkins. But not only that, Dr. Jacobson repeatedly called Jenkins a zealot for supporting nuclear [11].

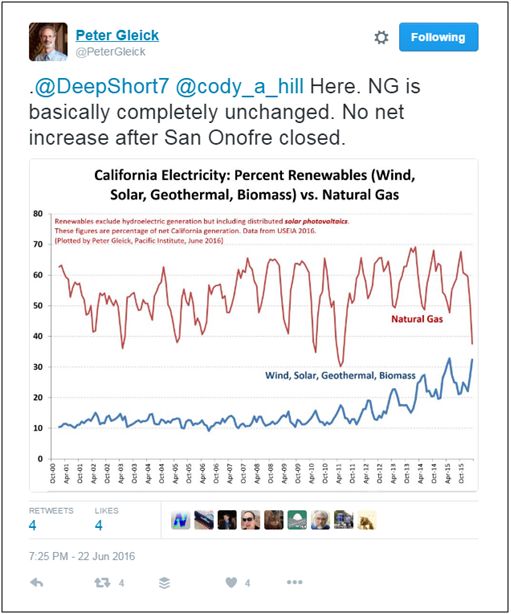
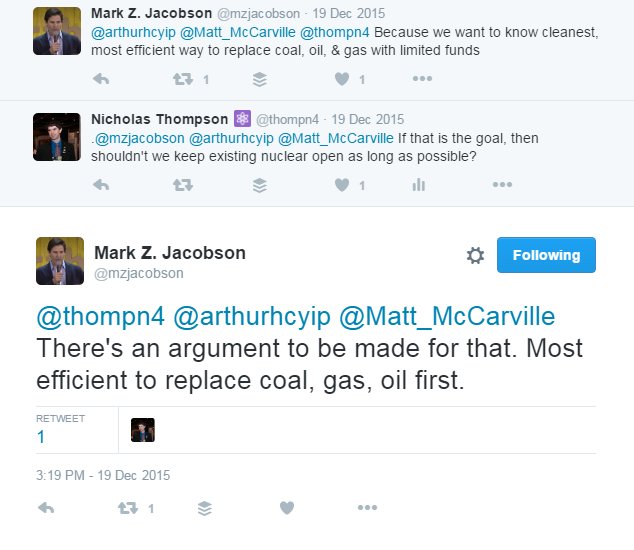
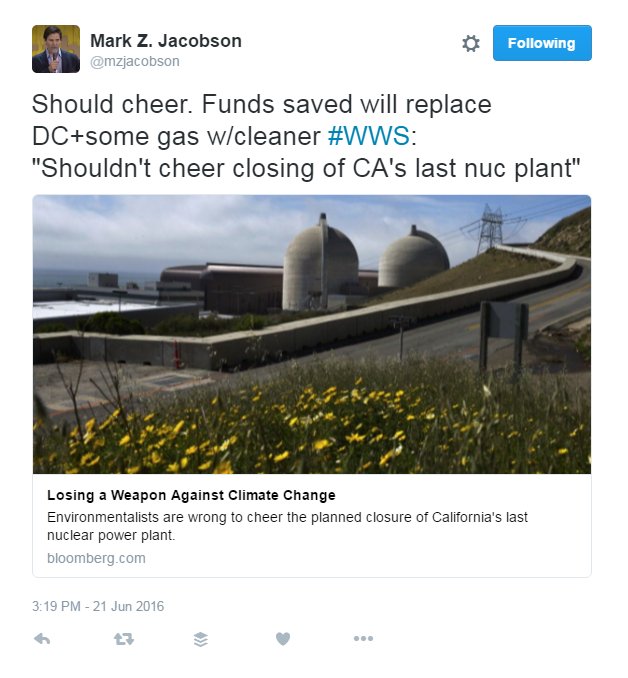
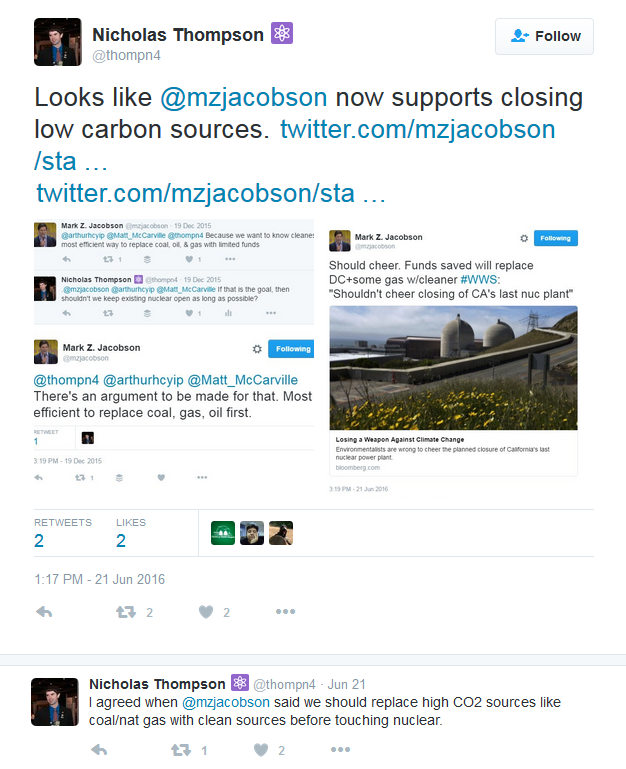
I’ve personally had a similar thing happen to me with Dr. Jacobson – I had a conversation with him on twitter in December of 2015 where I made the argument that we should keep existing low carbon nuclear operating for as long as possible, and at least then, Dr. Jacobson said “There’s an argument to be made for that. Most efficient to replace coal, gas, oil first.“[12] However, during June of 2016, it was announced that Diablo Canyon, a nuclear facility in California, would be shut down, and Dr. Jacobson said people, “Should cheer“[13] for its closure. I sent out a slightly snarky tweet with the juxtaposition of the two statements [14], and Dr. Jacobson claimed (without citing any numbers for the cost of relicensing or building the new sources) that it would be cheaper to build new WWS than to relicense Diablo Canyon [15]. I made the point that closing Diablo Canyon and replacing it with WWS would not actually decrease fossil fuel usage and carbon emissions, a restated the point that he made in December, that we should work on replacing fossil fuels. He responded back saying “You don’t know the first thing about solving the climate, air pollution and energy security problem. Stop pretending you do.” [16] And then he blocked me as well.

Jacobson_you dont know first thing about climate

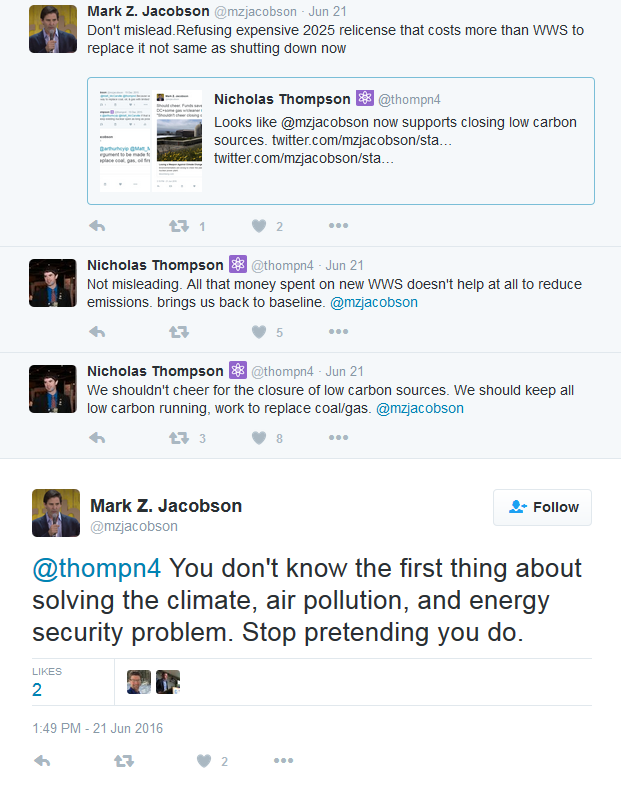
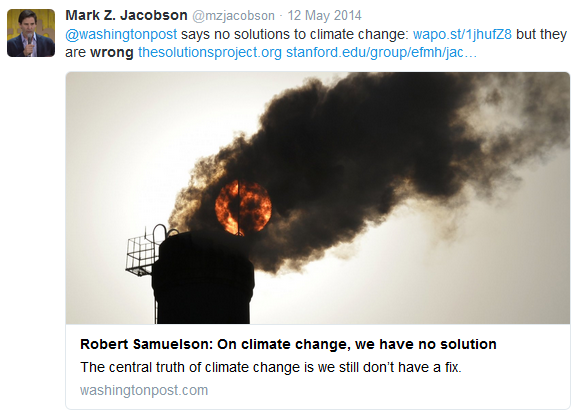
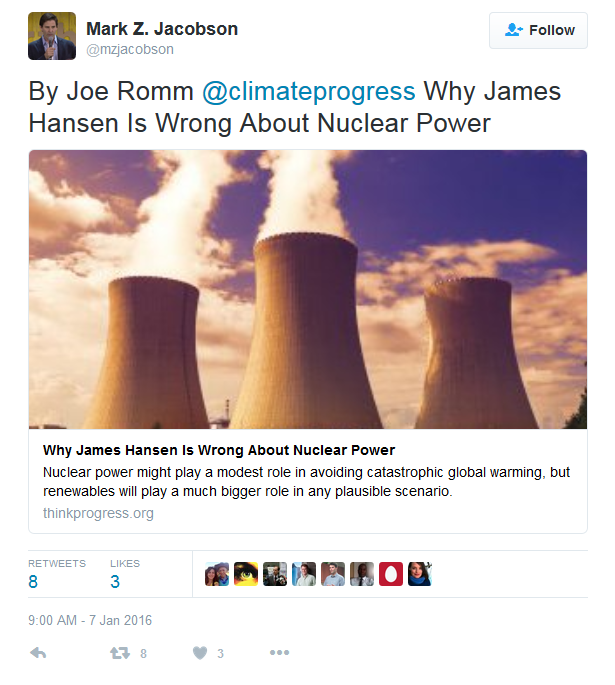
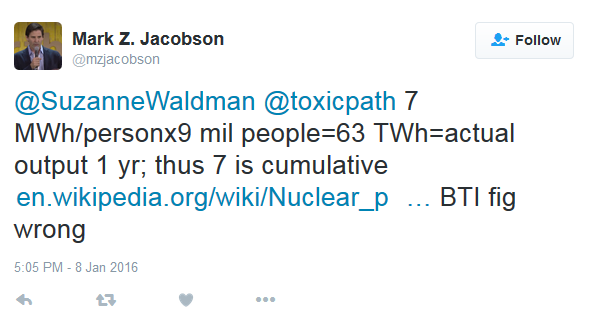
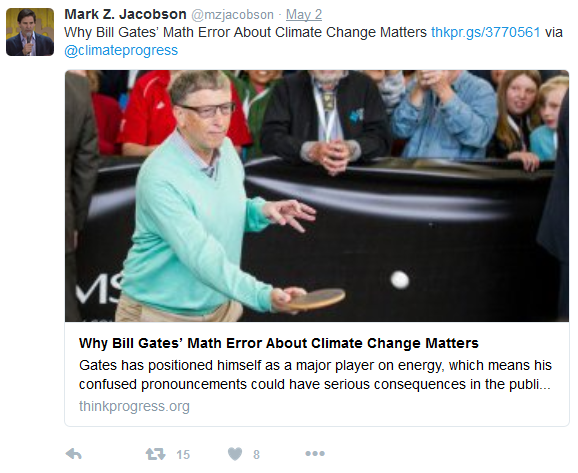
Figure 1: Dr. Jacobson’s tweets

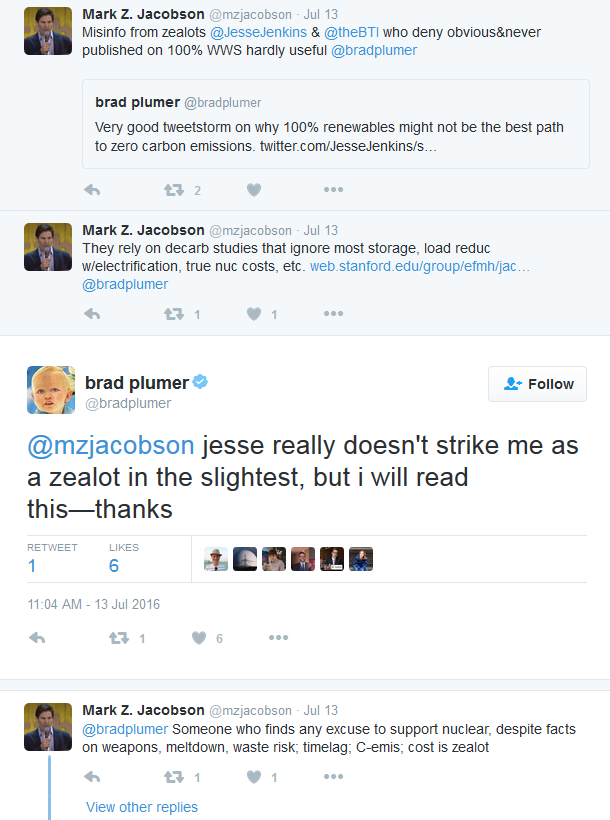
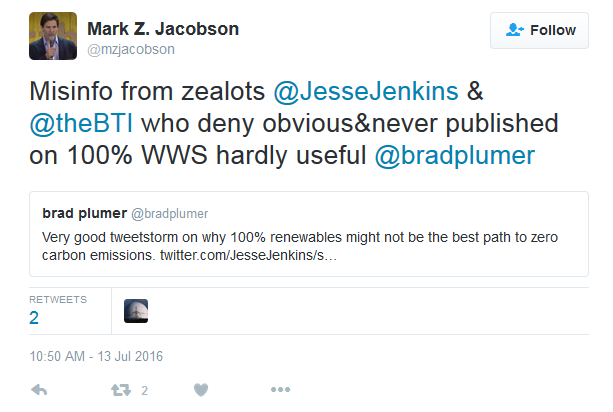
When Dr. Jacobson called Jenkins a zealot, he said (reproduced in Figure 2):
Misinfo from zealots Jesse Jenkins & Breakthrough Institute who deny obvious & never published on 100% WWS hardly useful
Someone who finds any excuse to support nuclear, despite facts on weapons, meltdown, waste risk; timelag; C-emis; cost is zealot

Jacobson_zealot1

Jacobson_zealot2

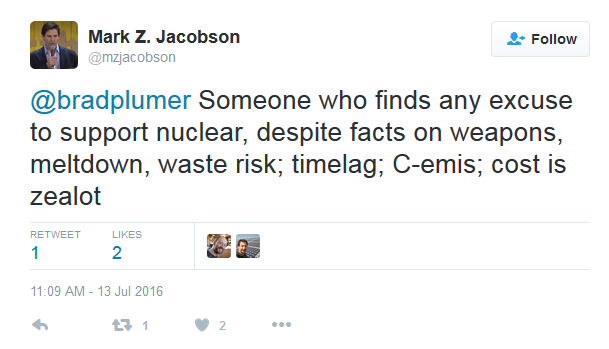
Figure 2: Dr. Jacobson’s tweets 

The definition of a zealot from Merriam-Webster is, “a person who has very strong feelings about something (such as religion or politics) and who wants other people to have those feelings: a zealous person“. In this context, you could say that someone who chooses to hold a belief despite overwhelming evidence to the contrary, and forcefully promotes that belief is a zealot. I’ve followed Jesse Jenkins work for a while, he does good work, is willing to debate with people about it, is willing to defend his work, and is willing to admit when he’s wrong. Because of this, I don’t think he’s a zealot as Dr. Jacobson claims.

But more to the point, Dr. Jacobson essentially just said that any person who supports nuclear energy is a zealot. As someone who supports nuclear energy and actively does research that can help make it safer, I wholeheartedly reject this assertion. Nuclear energy has its benefits, drawbacks, and risks, just like any other technology. And it’s important to recognize that. But to call that anyone that disagrees with you a “zealot” is a ludicrous statement. Moreover, if anyone who supports nuclear energy is a zealot, then President Obama, Secretary Clinton, many prominent scientists, and even the members of the IPCC would be considered zealots. Surely that’s not what Dr. Jacobson meant, but that is what he said.

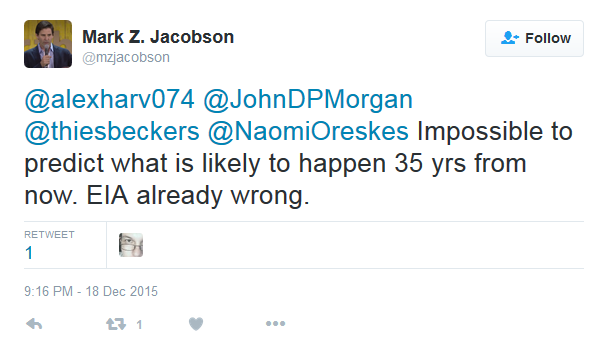
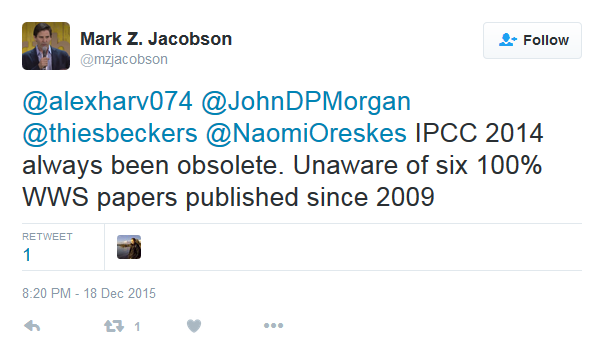
And instead of engaging in thoughtful debate with an open mind, Dr. Jacobson ignores criticism and shuts down debates through blocking people. In fact, you can search Dr. Jacobson’s entire twitter feed for the words “wrong” or “mistake”, and in his almost 4000 tweets, he’s never admitted that he’s wrong or that he made a mistake. He’s always saying other people are wrong. According to Dr. Jacobson, the EIA is wrong [17], the IPCC is wrong [18], the Washington Post is wrong [19], Dr. James Hansen is wrong [20], the Breakthrough Institute is wrong [21], Bill Gates is wrong [22], Jesse Jenkins is wrong [23], I’m wrong [24], just to name a few. Dr. Jacobson clearly has a certain set of beliefs, and those beliefs seem to be unshakable, even when the other researchers or the IPCC disagree with him.

It’s my personal opinion that we’ll need both renewables and nuclear, along with policy changes (price on carbon, clean energy standards) and other solutions like demand response, storage, and electric vehicles if we are going to significantly reduce emissions. I don’t know exactly what role nuclear will play in the future, but it is currently playing a large role in many countries (including the US) and will continue to be the largest single source of low carbon energy in the US for many years to come. Prematurely closing this generation will result in higher emissions, something that is becoming all to frequent.

The biggest problem in my opinion is the lack of political will and political action for climate solutions. It is important to debate what the best solutions are. But when Dr. Jacobson purposefully blocks people and calls people names for trying to critique his work or engage him in a dialogue, he is actively fracturing people into two competing “teams”, one team supporting nuclear, the other against it; in reality both sides want the same thing, to solve climate change.

So to anyone reading this, please try to tone down the rhetoric, and really try to understand other people’s views. It’s the only way that we can find some common solutions and move forward, together.

When nuclear is closed in California, what takes its place?

San_Onofre_Nuclear_Power_Plant

What replaced San Onofre?
Nicholas Thompson

It sounds like a pretty simple question, and the answer is actually pretty simple. To the first order, San Onofre, a low carbon nuclear facility in California that stopped operating in early 2012, was replaced with natural gas generation. Here’s a graph (Figure 1) of the change in electricity generation in California from 2011 to 2012, low carbon sources are colored blue, high carbon sources are red, and “Other imports” is a mix of sources. It’s pretty easy to see that there was a large drop in nuclear generation when San Onofre shut down, and at the same time, there was a drop in generation from hydroelectric dams. These two effects, along with the increase in total demand for electricity in 2012, created a large shortfall, which was primarily filled in by natural gas. There was also a large increase in imports from other states (which is a mix of fossil fuels, renewables, and nuclear).

California Electricity

Figure 1: Electricity Generation Changes from 2011 to 2012

So why do I even bring this up if it’s so obvious? Because there is a belief out there that renewables replaced San Onofre (Figure 2), and that natural gas usage did not increase when San Onofre closed (Figure 3). I don’t want to pick on any one person, but Dr. Peter Gleick has made both of these cases recently. Dr. Gleick is someone I respect very much – he co-founded and is the President of the Pacific Institute and is an expert on water resources and climate change. Here are two of his recent tweets about San Onofre. Now, it’s possible for him to make the argument that all the growth in wind, solar, geothermal, and biomass generation for the entire state of California from 2012-2015 equals the amount of electricity that San Onofre produced, and that’s just about right. But that’s not a reasonable argument – of those sources, biomass and geothermal have been rather constant over that time span, meaning that only solar and wind grew, and both of these sources are intermittent – meaning that much of the time that nuclear would have been producing electricity, solar and wind wouldn’t be. So it’s not fair or accurate to say that renewables “quickly/easily replaced San Onofre”, even today – more on this later.

Gleick_1

Figure 2: Dr. Gleick Tweet 1, renewables “quickly/easily replaced San Onofre.”
https://twitter.com/PeterGleick/status/745753823331835910

Dr. Gleick’s other argument states, “NG [natural gas] basically completely unchanged. No net increase after San Onofre closed.” As was seen before in Figure 1, there was a large increase in natural gas usage, an increase by over 33%. But more importantly, that level of natural gas consumption has stayed rather high ever since – it hasn’t come down as solar and wind have been added to the grid. And if you live in California, the reason is rather obvious – there’s no water. Hydroelectric generation has been decreasing ever since 2011, and 2015 was the worst year in decades for electricity produced by hydro in California.

Gleick_2

Figure 3: Dr. Gleick Tweet 2, “No net increase [in natural gas electricity generation] after San Onofre closed.” https://twitter.com/PeterGleick/status/745759654257385473

So what’s the net result? As is seen in Figure 4, the loss of San Onofre at the end of 2011, mixed with the low output of hydroelectricity, lead to a significant drop in low carbon generation in California (30,886 GWh or ~29% of low carbon generation lost from 2011 to 2012), and since then, low carbon energy generation has been completely flat. Natural gas generation, which in 2011 was at its lowest point since 1999, shot back up to near record highs, and has not decreased much since then.

TotalGeneration

Figure 4: Low Carbon Generation, Fossil Fuel Generation, and Imported Electricity in California

But let’s go back to that last claim, that solar and wind have quickly/easily replaced San Onofre. To really verify this claim, we’d need to go back and see what sources of electricity were operating when San Onofre would have been on an hour by hour basis. Luckily, the California Independent System Operator has this data, available here. All the compiled data can be found here. Solar and wind have both daily fluctuations in generation and seasonal fluctuations, so based on the generation of wind and solar on an hour by hour basis, I calculated the average generation for each hour over each month for 2011 (the last year San Onofre was operating). For example, in Figure 5 (which shows generation as a percent of San Onofre’s generation in 2011 [18107 GWh, Average of 2067 MW]), during the summer of 2011, there was more electricity being generated from wind than solar, so the curve looks pretty flat throughout the “average” day. But by the summer of 2015, a substantial increase in the total solar generation capacity lead to a large increase in electricity generated from solar, giving the plot a peak in the middle of the day.

I then looked at the actual hourly generation for wind and solar for each hour in 2012, and subtracted the expected generation for that month and hour of the day based on the 2011 data to calculated the additional electricity generated from new sources. This allowed me to estimate the additional generation on an hourly basis, and see how much of San Onofre’s generation was actually replaced by wind and solar, each year.

WindSolar

Figure 5: Hourly Average Electricity Generation from Wind and Solar Combined for Select Months

The results? If you look at the data on an hour by hour basis, then there were 3777 hours in 2015 that new wind and solar (added to the grid after 2011) generated more electricity than San Onofre did in 2011. Results on a year by year basis can be seen below in Table 1. And from Figure 5 above, it’s pretty easy to see why – during the summer, solar generates a lot of electricity, but it’s not all generated when San Onofre would have. It’s also important to note that Figure 5 is an average – even in 2015, 8.5% of the time, wind and solar generated less than 10% of what San Onofre would have been generating. And what’s picking up the slack during that 57% of the time that wind and solar aren’t producing enough electricity to replace San Onofre? Natural gas.

Table 1: Number of Hours that Wind and Solar added to the grid after 2011 generated as much or more electricity than San Onofre did in 2011

2012 2013 2014 2015
Hours 73 1740 3485 3777
Percentage 0.88 19.86 39.78 43.12

Figure 6 shows average hourly generation from fossil fuels – the California ISO data does not break out natural gas separately, but nearly all the fossil fuel generation in California is natural gas. As explained before, 2012 saw a huge increase in natural gas usage, due to the closure of San Onofre and the decrease in hydroelectric generation. Another interesting feature that can be readily identified is the decrease in the need for fossil fuels during the middle of the day due to the increase in solar generation at that time.

Thermalplot

Figure 6: Average Hourly Generation for Fossil Fuels

By generating the same plot as Table 1 for additional fossil fuels, in Table 2 it can be seen that 74.87% of the time during 2012, additional fossil fuels were completely replacing  San Onofre. This number has come down some, but is still above 50% – meaning more than half the time in 2015, additional fossil fuels generated more electricity than San Onofre.

Table 2: Number of Hours that additional fossil fuels generated as much or more electricity than San Onofre did in 2011

2012 2013 2014 2015
Hours 6272 6501 6112 4871
Percentage 71.60 74.21 69.77 55.61

In summary;

  • San Onofre was primarily replaced by natural gas, this can be demonstrated by looking at raw GWh/year and an hour by hour analysis,
  • The closure of San Onofre coincided with a huge boom in wind and solar, but also a huge drought, so the share of clean energy dropped substantially from 2011 to 2012 and has not changed much since,
  • While solar and wind that have been added to the grid since 2011 now generate more generation than San Onofre did, they do not generate electricity at the same times that San Onofre did, as solar generation peaks during the day; because of this it is not accurate to say that additional wind and solar have replaced San Onofre, even now.

If you liked this article or have any comments, please contact me at nicholas@thompson.energy

Hope you have a great day!