
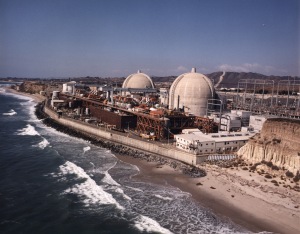
What replaced San Onofre?
Nicholas Thompson
It sounds like a pretty simple question, and the answer is actually pretty simple. To the first order, San Onofre, a low carbon nuclear facility in California that stopped operating in early 2012, was replaced with natural gas generation. Here’s a graph (Figure 1) of the change in electricity generation in California from 2011 to 2012, low carbon sources are colored blue, high carbon sources are red, and “Other imports” is a mix of sources. It’s pretty easy to see that there was a large drop in nuclear generation when San Onofre shut down, and at the same time, there was a drop in generation from hydroelectric dams. These two effects, along with the increase in total demand for electricity in 2012, created a large shortfall, which was primarily filled in by natural gas. There was also a large increase in imports from other states (which is a mix of fossil fuels, renewables, and nuclear).

Figure 1: Electricity Generation Changes from 2011 to 2012
So why do I even bring this up if it’s so obvious? Because there is a belief out there that renewables replaced San Onofre (Figure 2), and that natural gas usage did not increase when San Onofre closed (Figure 3). I don’t want to pick on any one person, but Dr. Peter Gleick has made both of these cases recently. Dr. Gleick is someone I respect very much – he co-founded and is the President of the Pacific Institute and is an expert on water resources and climate change. Here are two of his recent tweets about San Onofre. Now, it’s possible for him to make the argument that all the growth in wind, solar, geothermal, and biomass generation for the entire state of California from 2012-2015 equals the amount of electricity that San Onofre produced, and that’s just about right. But that’s not a reasonable argument – of those sources, biomass and geothermal have been rather constant over that time span, meaning that only solar and wind grew, and both of these sources are intermittent – meaning that much of the time that nuclear would have been producing electricity, solar and wind wouldn’t be. So it’s not fair or accurate to say that renewables “quickly/easily replaced San Onofre”, even today – more on this later.

Figure 2: Dr. Gleick Tweet 1, renewables “quickly/easily replaced San Onofre.”
https://twitter.com/PeterGleick/status/745753823331835910
Dr. Gleick’s other argument states, “NG [natural gas] basically completely unchanged. No net increase after San Onofre closed.” As was seen before in Figure 1, there was a large increase in natural gas usage, an increase by over 33%. But more importantly, that level of natural gas consumption has stayed rather high ever since – it hasn’t come down as solar and wind have been added to the grid. And if you live in California, the reason is rather obvious – there’s no water. Hydroelectric generation has been decreasing ever since 2011, and 2015 was the worst year in decades for electricity produced by hydro in California.

Figure 3: Dr. Gleick Tweet 2, “No net increase [in natural gas electricity generation] after San Onofre closed.” https://twitter.com/PeterGleick/status/745759654257385473
So what’s the net result? As is seen in Figure 4, the loss of San Onofre at the end of 2011, mixed with the low output of hydroelectricity, lead to a significant drop in low carbon generation in California (30,886 GWh or ~29% of low carbon generation lost from 2011 to 2012), and since then, low carbon energy generation has been completely flat. Natural gas generation, which in 2011 was at its lowest point since 1999, shot back up to near record highs, and has not decreased much since then.

Figure 4: Low Carbon Generation, Fossil Fuel Generation, and Imported Electricity in California
But let’s go back to that last claim, that solar and wind have quickly/easily replaced San Onofre. To really verify this claim, we’d need to go back and see what sources of electricity were operating when San Onofre would have been on an hour by hour basis. Luckily, the California Independent System Operator has this data, available here. All the compiled data can be found here. Solar and wind have both daily fluctuations in generation and seasonal fluctuations, so based on the generation of wind and solar on an hour by hour basis, I calculated the average generation for each hour over each month for 2011 (the last year San Onofre was operating). For example, in Figure 5 (which shows generation as a percent of San Onofre’s generation in 2011 [18107 GWh, Average of 2067 MW]), during the summer of 2011, there was more electricity being generated from wind than solar, so the curve looks pretty flat throughout the “average” day. But by the summer of 2015, a substantial increase in the total solar generation capacity lead to a large increase in electricity generated from solar, giving the plot a peak in the middle of the day.
I then looked at the actual hourly generation for wind and solar for each hour in 2012, and subtracted the expected generation for that month and hour of the day based on the 2011 data to calculated the additional electricity generated from new sources. This allowed me to estimate the additional generation on an hourly basis, and see how much of San Onofre’s generation was actually replaced by wind and solar, each year.

Figure 5: Hourly Average Electricity Generation from Wind and Solar Combined for Select Months
The results? If you look at the data on an hour by hour basis, then there were 3777 hours in 2015 that new wind and solar (added to the grid after 2011) generated more electricity than San Onofre did in 2011. Results on a year by year basis can be seen below in Table 1. And from Figure 5 above, it’s pretty easy to see why – during the summer, solar generates a lot of electricity, but it’s not all generated when San Onofre would have. It’s also important to note that Figure 5 is an average – even in 2015, 8.5% of the time, wind and solar generated less than 10% of what San Onofre would have been generating. And what’s picking up the slack during that 57% of the time that wind and solar aren’t producing enough electricity to replace San Onofre? Natural gas.
Table 1: Number of Hours that Wind and Solar added to the grid after 2011 generated as much or more electricity than San Onofre did in 2011
| 2012 | 2013 | 2014 | 2015 | |
| Hours | 73 | 1740 | 3485 | 3777 |
| Percentage | 0.88 | 19.86 | 39.78 | 43.12 |
Figure 6 shows average hourly generation from fossil fuels – the California ISO data does not break out natural gas separately, but nearly all the fossil fuel generation in California is natural gas. As explained before, 2012 saw a huge increase in natural gas usage, due to the closure of San Onofre and the decrease in hydroelectric generation. Another interesting feature that can be readily identified is the decrease in the need for fossil fuels during the middle of the day due to the increase in solar generation at that time.

Figure 6: Average Hourly Generation for Fossil Fuels
By generating the same plot as Table 1 for additional fossil fuels, in Table 2 it can be seen that 74.87% of the time during 2012, additional fossil fuels were completely replacing San Onofre. This number has come down some, but is still above 50% – meaning more than half the time in 2015, additional fossil fuels generated more electricity than San Onofre.
Table 2: Number of Hours that additional fossil fuels generated as much or more electricity than San Onofre did in 2011
| 2012 | 2013 | 2014 | 2015 | |
| Hours | 6272 | 6501 | 6112 | 4871 |
| Percentage | 71.60 | 74.21 | 69.77 | 55.61 |
In summary;
- San Onofre was primarily replaced by natural gas, this can be demonstrated by looking at raw GWh/year and an hour by hour analysis,
- The closure of San Onofre coincided with a huge boom in wind and solar, but also a huge drought, so the share of clean energy dropped substantially from 2011 to 2012 and has not changed much since,
- While solar and wind that have been added to the grid since 2011 now generate more generation than San Onofre did, they do not generate electricity at the same times that San Onofre did, as solar generation peaks during the day; because of this it is not accurate to say that additional wind and solar have replaced San Onofre, even now.
If you liked this article or have any comments, please contact me at nicholas@thompson.energy
Hope you have a great day!

Nicholas, thanks for your analysis. I think we’re MOSTLY in agreement, but think you’ve made a couple of logical errors. First, without a doubt, NG replaced San Onofre right away. My argument about renewables (as you can see in the graph I produced) was that within three years, the amount of electricity generated by new renewables MORE than compensated for the electricity lost at SONGS. Sure it’s not always at the same time of day, but the total annual generation from new renewables now exceeds SONGs. And the drought is a key reason why NG hasn’t fallen farther. As I noted in the analysis of the drought on California’s energy system (available at http://www.pacinst.org), lost hydropower is made up by additional NG. Without the drought, today’s NG fraction would be quite a bit lower than it is, and lower than when SONGs shut down. One final point, make sure you include rooftop solar generation in your analysis. I did, by using the EIA data, which now includes distributed solar. But the standard energy data from the State of California does NOT include this (unless you really dig for the data), which leads to underestimates of actual current CA renewables generation. Thanks, Peter Gleick
LikeLiked by 1 person
Dr. Gleick, thanks for your comments!
I’ll add an update to the post to include rooftop/distributed solar, that’s a point well taken.
As for your other point though, I don’t think it’s fair or completely accurate to say ‘nuclear was replaced by renewables, and hydro was replaced by natural gas’, when someone else could just as easily say the opposite (‘nuclear was replaced by natural gas, and hydro was replaced by renewables’). In reality, nuclear and hydro were replaced by renewables and natural gas – and this was the point to the second part of my analysis, to see exactly what energy sources replaced nuclear on an hour by hour basis – for this year, it’ll probably be close to half renewables, half natural gas.
This gives some insight into what will happen when Diablo Canyon is closed – it does not seem like there will be much growth in hydro (aside from coming back to baseline once the drought is over), so it will most likely be a combination of renewables and natural gas which replace Diablo Canyon when it shuts down. From a climate perspective, it would be advantageous to keep Diablo Canyon open for as long as possible, and keep as much low carbon energy on the grid as possible.
Thanks again,
Nick
LikeLiked by 2 people
For those wanting to keep Mother Earth: Our sole laser focus should be reducing carbon emissions. Any “solution” must be rigorously tested. Does that solution significantly reduce carbon compared to others?
The aim of many, it seems is to simply promote their favorite solution – solar, wind, hydro, wave energy, bio fuel, nuclear, hamsters – whatever. Building in vogue “solutions” is NOT the goal. Drastically cutting emissions IS.
This is a race to the finish now, folks. The finish options are two: drastic reduction of carbon, or drastic reduction of life on earth.
William Gloege
CGNP.org
Nick – go check out Germany’s “Big Renewable Gamble.” Its not playing out like the renewable fairy tale is supposed to. .
LikeLike
“…NG fraction would be quite a bit lower than it is, and lower than when SONGs shut down.”
When hydro returns to normal, it will be used for the same purposes as before the drought and before the additional wind and solar. You need an increase in natural gas to chase the additional wind and solar around. Why would natural gas use will drop to lower levels than when SONGs shut down?
I recently created a simplified graphic to try to explain why you end up with more emissions when nuclear is replaced with wind, solar, and natural gas: https://4.bp.blogspot.com/-pnZ5aQV5iiw/V3swgn8uRgI/AAAAAAAADyQ/JvaDdpwBYcoyozQf_J8M6gnIa7OyMZkrwCKgB/s640/WindVsNuclear.JPG (used in this article:http://biodiversivist.blogspot.com/2016/07/our-future-is-in-low-carbon-energy-not.html ).
Simple statements like “renewables “quickly/easily replaced San Onofre” are easy for the general public to understand but are also misleading.
A more honest statement would be: “Wind and solar eventually added as much energy to the grid as San Onofre was supplying but because this required the additional use of gas fueled peaking and load following power stations, GHG emissions are now higher than before San Onefre was closed and will be higher still when Diablo Canyon is closed.”
Evidence that California is going backwards can be found at this post:
http://euanmearns.com/renewable-california/
You have a small typo: “…fossil fuels were generated more electricity…”
Great article.
LikeLike
Good analysis. Particularly noted was the misstatement of the environmentalist with a bias and an agenda.
LikeLike
Pingback: When nuclear closed in California | Northwest Clean Energy
CPUC on 10m Feb approved 600MW of new gas generation just to make up for 1/4 San Onofre. We are a gas state, enabled by the 2005 repeal of the 1935 PUHCA. Look it up.
LikeLike
Pingback: Weekly Climate and Energy News Roundup #231 | Watts Up With That?
Pingback: A more detailed look at the California grid data | Energy Matters